9.4.1Introduction#
Aerial agents (satellites, high-altitude platform stations (HAPS), and unmanned aerial vehicles (UAVs)) acquire rich, dynamic, large-scale observations from the sky and near space and, increasingly, perceive, decide, and act on them autonomously through onboard processing and adaptive control (Table 9.5). The aerial domain is a demanding testbed for the spatial capabilities surveyed in Part III: it stresses perception across extreme scale and viewpoint changes (Chapter 6) and decision-making under partial observability and tight latency budgets (Chapter 7), across platform tiers that differ in altitude, resolution, endurance, and latency by orders of magnitude.
Satellites supply the global tier. Navigation constellations, namely GPS [2472, 2473] within the broader Global Navigation Satellite System (GNSS) [2474], Russia’s GLONASS [2475], the European Union’s Galileo [2476], and China’s BeiDou [2477, 2478], provide the positioning, navigation, and timing on which vehicles [2479], smartphones [2480], network synchronization [2481], and every lower aerial tier rely. Earth-observation satellites operate continuously over years, which suits long-term, wide-area monitoring that neither ground sensors nor short-endurance UAVs can provide: seasonal vegetation dynamics [2482], wildlife migration [2483], river-basin ecosystem health [2484], deforestation [2485, 2486], desertification [2487, 2488], biodiversity loss [2489], and climate indicators such as land surface temperature, ocean color, and atmospheric composition [2490, 2491], together with ecological conservation [2492, 2493], multispectral and hyperspectral resource discovery [2494, 2495], precision agriculture [2496, 2497] and crop-yield estimation [2498, 2499], and the detection of algal blooms [2500] and pollutant leakage [2501].
| Parameter | Satellite | HAPS | UAV |
| Altitude | 500–36,000 km | 20–50 km | ¡ 10 km |
| Spatial Resolution | m to sub-m | dm to cm | cm-level |
| Temporal Coverage | Hours–days revisit | Persistent (regional) | Real-time (local) |
| Coverage Area | Global/regional | Regional | Localized |
| Endurance | Years | Months | Hours |
| Maneuverability | Minimal | Limited | High |
| Data Latency | High | Medium | Low |
| Payload Capacity | High | Moderate | Low |
| Onboard Processing | Limited | Moderate | High |
| Atmospheric Impact | Minimal | Low | High |
| Deployment Speed | Slow | Medium | Fast |
| Cost Structure | High (low per area) | Medium | Low (high per area) |
Differently, UAVs, commonly known as drones, have gained widespread popularity due to their agility, low operational cost, and capability for autonomous operation. Equipped with onboard sensors and processing units, UAVs can perceive their surroundings, plan flight paths, and adapt to dynamic conditions in real time. This unique perspective allows UAVs to capture high-resolution imagery and video from flexible vantage points, enabling frequent revisits and reduced occlusions in complex environments. Compared to satellites, UAVs excel in capturing fine-grained, localized data, and can be rapidly deployed to areas of interest, including hazardous or otherwise inaccessible regions. They now serve aerial photography [2502, 2503], cinematography [2504, 2505], environmental mapping [2506, 2507, 2508], precision agriculture [2509, 2510], geolocalization [2511, 2512, 2513, 2514, 2515, 2516, 2517, 2518, 2519], and last-mile delivery [2520, 2521].
Filling the altitude gap between satellite systems and UAVs, emerging platforms such as stratospheric balloons, solar-powered high-altitude platform stations, and small satellite constellations (e.g., , CubeSats [2522]) are increasingly being integrated into aerial observation networks. These high-altitude platform stations (HAPS) offer complementary advantages: HAPS [2523] provide persistent regional coverage with higher spatial resolution than satellites, while orbital systems [2524] enable global, long-term monitoring at varying temporal and spectral scales. Together, they form a multi-tiered aerial ecosystem capable of capturing heterogeneous multimedia data, from visible and thermal imagery to hyperspectral and LiDAR scans, across spatiotemporal scales unattainable by any single platform alone. For instance, solar-powered HAPS such as Airbus Zephyr [2525] or HAWK30 by AeroVironment/HAPSMobile [2526] can operate autonomously in the stratosphere (about 20 km altitude) for weeks, offering persistent observation and communication relay services with sub-meter resolution, which is superior to most Earth observation satellites and at lower cost than maintaining UAV fleets.
A growing trend is the coordination of heterogeneous aerial agents into cooperative networks, where satellites offer global context, HAPS serve as communication relays or edge computing nodes, and UAVs execute localized missions, enabling real-time, closed-loop intelligence. The utility of these systems is further amplified by advances in artificial intelligence, including machine learning, computer vision, big data analytics, and transfer learning [2527, 2528, 2529]. These technologies empower intelligent processing of massive aerial datasets, enabling automated image and video analysis [2530, 2531, 2532, 2533, 2534, 2535], real-time object detection and tracking [2536, 2537], predictive modeling for urban dynamics [2538, 2539], natural language-based control interfaces [2540], and city-scale digital twin simulations [2541]. Data privacy, airspace integration, energy efficiency, and operational robustness remain open, and are taken up in the Challenges below.
9.4.2System Overview#
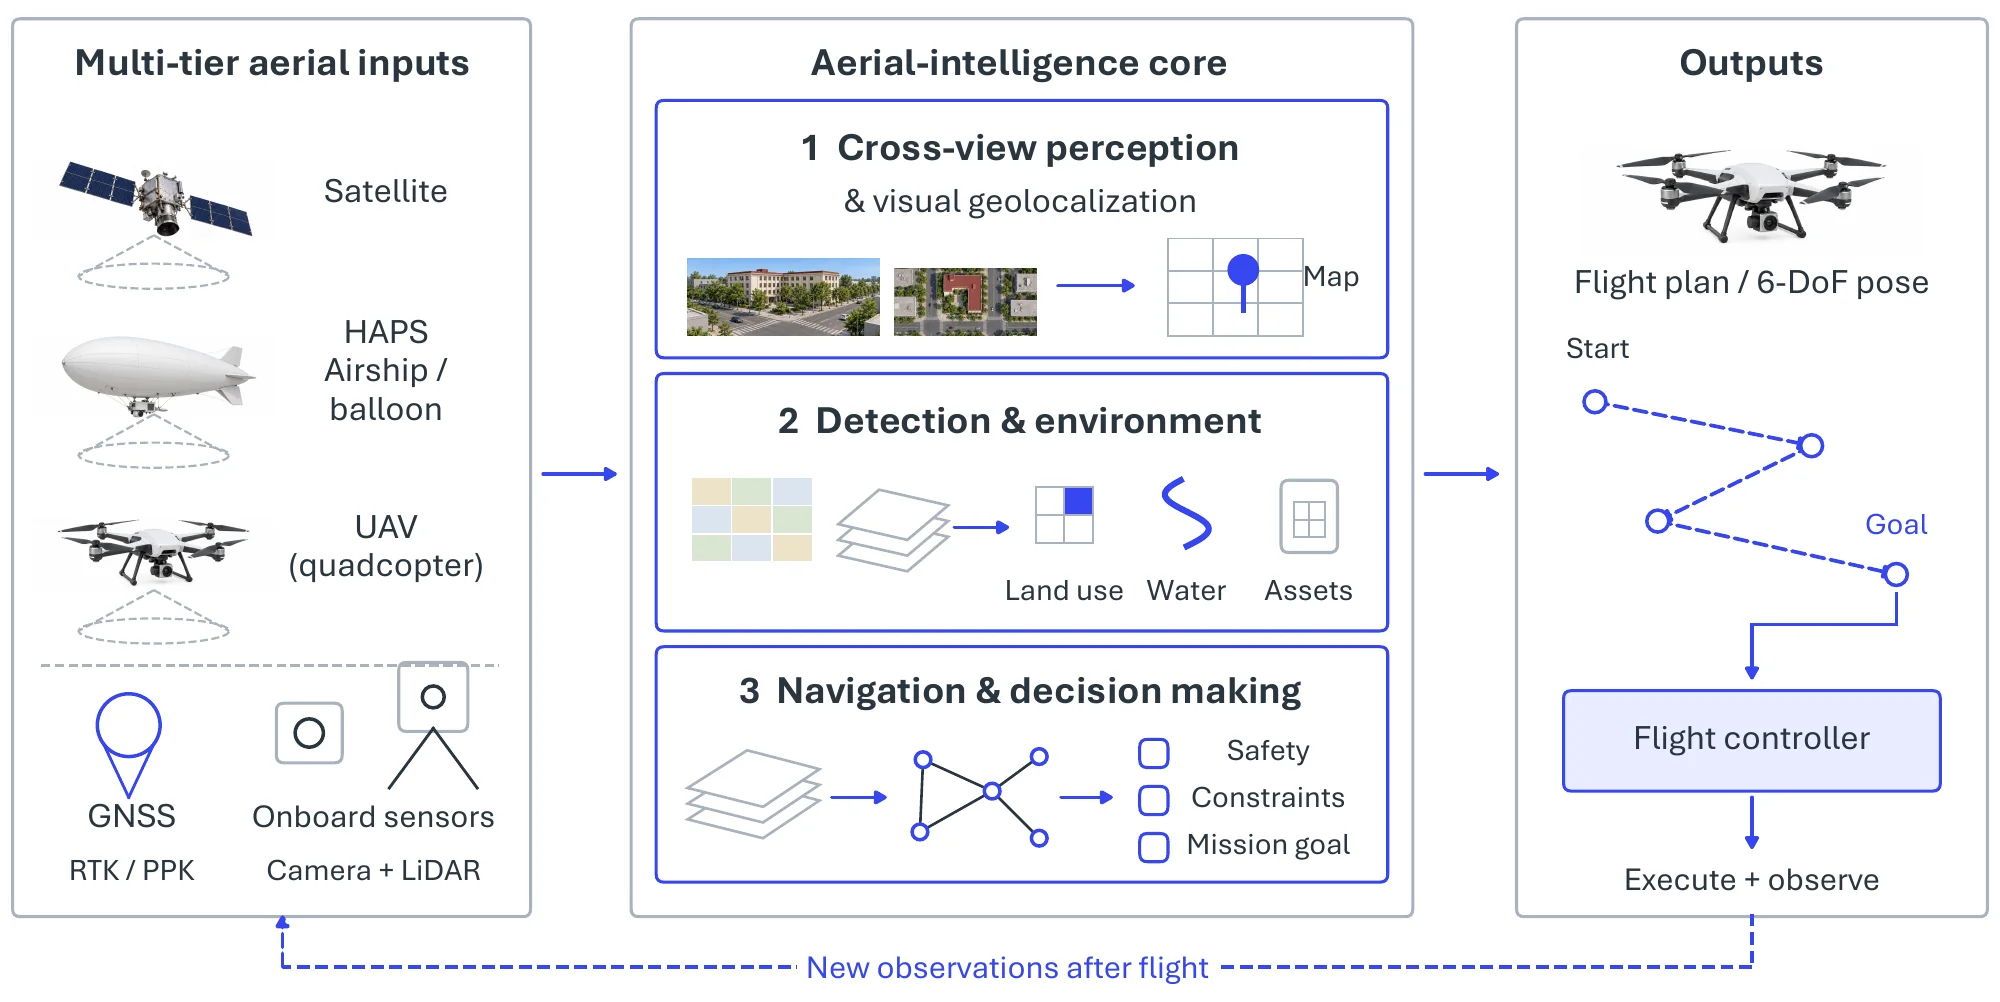
An aerial agent realizes a sensing-to-action loop that spans the multi-tier ecosystem of Table 9.5: satellites supply global context and positioning, HAPS act as persistent regional relays and edge-computing nodes, and UAVs execute localized, low-latency missions at the point of interest. Across this stack, spatial intelligence is exercised through three complementary stages, which constitute the pivotal tasks of this section. Cross-view perception anchors aerial and ground observations to a common geographic frame, so that what a drone sees can be matched to a map or a street-level query (Pivotal Task-1); remote-sensing detection and environmental understanding turn that imagery into structured scene knowledge about objects, layouts, and human activity (Pivotal Task-2); and autonomous navigation and decision making convert perception into flight plans and control actions in unseen environments (Pivotal Task-3). Figure 9.15 sketches this pipeline, with a feedback path from action back onto sensing that ties the three stages into one closed loop rather than a feed-forward chain.
9.4.3Pivotal Task-1: Ground-Air Collaborative Perception and Visual Geolocalization#
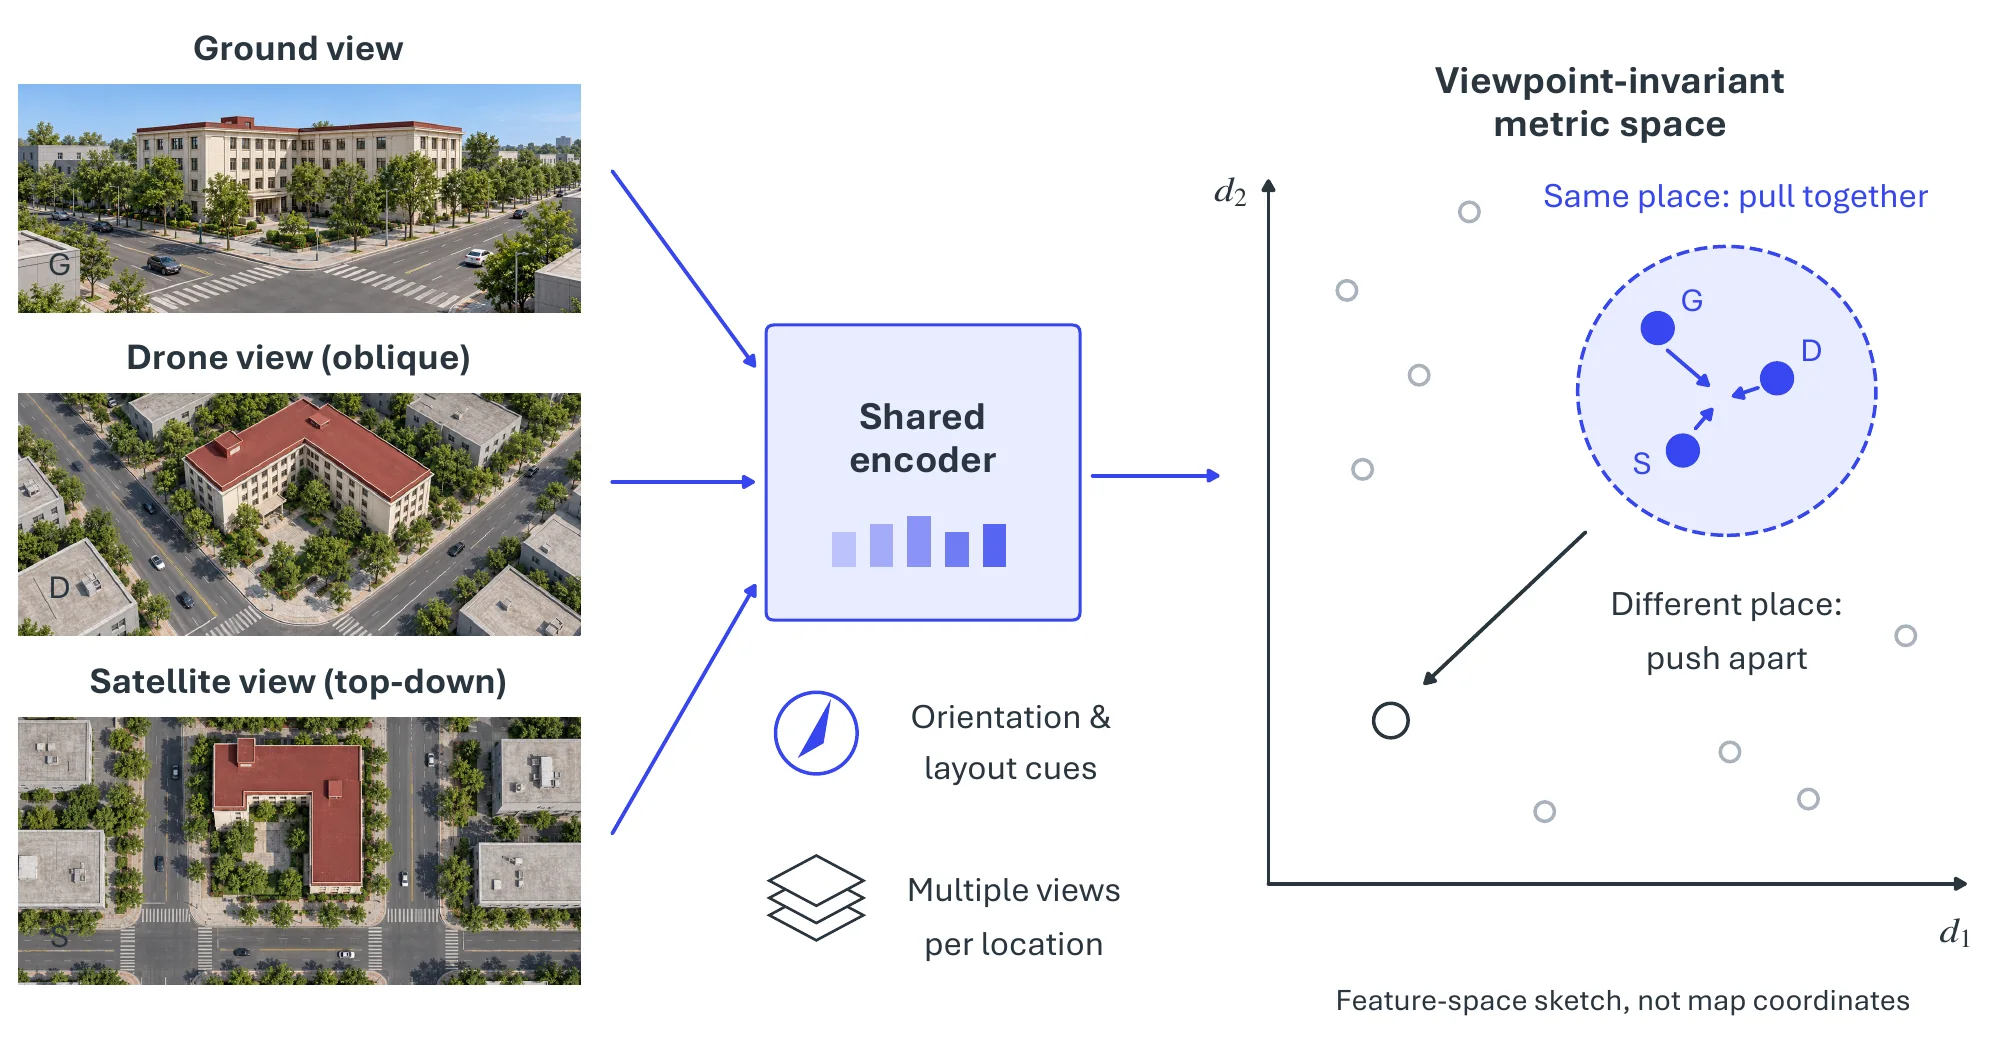
A foundational requirement of any aerial system is to place its observations on the map: the integration of ground-level and aerial views for cross-modal understanding enables visual geolocalization, determining the geographic location of a query image by matching it against a reference database. This task anchors the perception stage of the system and is particularly challenging due to the large modality gap between ground street-view images and overhead (aerial or satellite) imagery, an instance of the cross-view correspondence problem treated more generally in Chapter 6. For instance, the University-1652 dataset [2506] has become a benchmark for this task, offering ground, drone and satellite image triplets of campus buildings, thus facilitating research on cross-view matching and localization. Such capabilities are critical for urban search-and-rescue, augmented reality, and infrastructure monitoring, where precise alignment between ground observations and aerial maps is essential. Progress has come from bridging the modality gap, encoding spatial structure into a viewpoint-invariant representation, and exploiting multiple views per location (Figure 9.16).
Bridging the modality gap. Most extant research frames geolocalization as a cross-view image retrieval problem, where the core challenge is to learn a viewpoint-invariant representation that effectively bridges the disparity between images captured from different perspectives. Recent advances in deep learning have led to the widespread application of Convolutional Neural Networks (CNNs) and Vision Transformers (ViTs) for extracting robust visual features. One prominent line of inquiry employs metric learning to construct a shared latent space for images acquired from diverse platforms. Workman et al. [2542] show that a CNN pre-trained on the Places dataset [596] can, by itself, yield highly discriminative features without explicit fine-tuning for the task. The integration of contrastive loss, which minimizes the distance between positive pairs in the feature space, further enhances geolocalization performance [2543, 2544]. Liu et al. [2545] introduce the Stochastic Attraction and Repulsion Embedding (SARE) loss, which minimizes the Kullback-Leibler divergence between the learned and actual data distributions, and more recently Deuser et al. [2546] show that hard negative sampling strategies also significantly influence the final discriminative power.
Encoding spatial structure. Another significant body of work addresses the problem of spatial misalignment in ground-to-aerial matching, injecting geometric priors into the representation. Vo et al.evaluate various network architectures and propose an orientation regression loss to train an orientation-aware network [2547]. Zhai et al. [2548] utilize semantic segmentation maps to facilitate semantic alignment, while Hu et al. [2549] incorporate a NetVLAD layer to extract more discriminative features. Subsequently, Liu et al. [2511] propose a Siamese Network to explicitly integrate spatial cues, such as orientation maps, into the training process, and Shi et al. [2513] introduce a spatial-aware layer to improve localization performance. Given that each location has multiple training images from different viewpoints, Zheng et al. [2506] train a multi-branch CNN as a base model. Building upon this multi-branch architecture, Wang et al. [2507] further partition the feature map into multiple segments to improve matching discriminability, while Lin et al. [2508] incorporate keypoint detection into the learning process. More recently, researchers resort to ViT structures: L2LTR [2550] adopts a hybrid CNN-ViT architecture, leveraging CNNs to extract high-level semantic features and ViTs to encode them into global representations; GeoDTR [2551] further enhances geometric reasoning by introducing a ViT-based layout extractor that generates geometry-aware attention maps; and TransGeo [2552] advances the paradigm with a two-branch ViT model and a two-stage coarse-to-fine learning strategy.
| Dataset | Univ.-1652 [2506] | SUES-200 [2553] | CVUSA [2548] | CVACT [2511] | Lin et al. [2544] | Tian et al. [2554] | Vo et al. [2547] |
| #Train imgs. | 70171.6 | 120 loc. | 35.5k2 | 35.5k2 | 37.5k2 | 15.7k2 | 900k2 |
| Platform | Drone, Ground, Sat. | Drone, Sat. | Ground, Sat. | Ground, Sat. | Ground, 45∘ Aerial | Ground, 45∘ Aerial | Ground, Sat. |
| Imgs./loc. | 54+16.6+1 | drone + 1 | 1+1 | 1+1 | 1+1 | 1+1 | 1+1 |
| Target | Building | Diverse | User | User | Building | Building | User |
| Eval. | R@K, AP | R@K, AP | R@K | R@K | PR, AP | PR, AP | R@K |
From image pairs to multi-view benchmarks. The maturation of these methods is closely tied to the datasets that score them (see Table 9.6). The majority of prior geolocalization datasets are based on image pairs, designed for matching images from two distinct platforms such as terrestrial cameras and satellites. One of the earliest contributions [2544] leverages public sources to create 78,000 image pairs spanning a 45-degree bird’s-eye perspective and the ground. In a similar vein, Tian et al. [2554] compile image pairs for urban localization, positing that buildings are crucial for this task and thus incorporating building detection into their pipeline. The CVUSA [2548] and CVACT [2511] datasets instead address matching panoramic ground-view images with satellite-view images, which is particularly useful for user localization when GPS data is unavailable. A key distinction is one of objective: the latter two focus on localizing the user who captures the photograph, while the former focus on localizing a specific target within the image, so that multiple views of the target are more beneficial for the target-localization datasets (Lin et al., Tian et al.) because they encourage the model to learn the target’s structure. However, most existing datasets typically provide only two views of a given location. The University-1652 dataset [2506] addresses this by including a greater number of views per target, thereby fostering more robust viewpoint-invariant features; SUES-200 [2553] follows a similar multi-view strategy with drone-captured real-world data. Wang et al. [2527] further extend University-1652 to multi-weather evaluation (rain, fog, and other complex conditions), while Chu et al. [2540] introduce linguistic annotations and a language-based query setting for a more intuitive user experience.
Metrics. These benchmarks are scored by retrieval metrics that reflect their gallery structure. Several datasets [2511, 2548, 2547] adopt Recall@K, defined as 1 if a correct match appears within the top K retrieved images; Recall@K is highly sensitive to the rank of the first correct match and is best suited for test sets containing only a single ground-truth match in the gallery. In contrast, datasets such as University-1652 [2506] and SUES-200 [2553] include multiple ground-truth matches from various viewpoints, where Recall@K fails to comprehensively reflect retrieval performance; they therefore also employ Average Precision (AP), as used by Lin et al. [2544] and Tian et al. [2554]. AP, defined as the area under the Precision-Recall (PR) curve, considers all ground-truth images in the gallery, and recent evaluations usually report both Recall@K and the mean Average Precision (mAP) across all queries.
9.4.4Pivotal Task-2: Remote Sensing Detection and Environmental Understanding#
Once observations are geolocalized, the next stage turns aerial imagery into structured scene knowledge. Aerial platforms are integral to large-scale environmental monitoring and public safety, facilitating fine-grained object detection in complex scenes, a specialization of the detection and segmentation machinery of Chapter 6 to the aerial viewpoint. Prominent datasets such as DOTA [2555], DOTA-v2 [2555, 2556], and VisDrone [2557] provide comprehensive annotations for detecting various objects, including vehicles and pedestrians, under a wide range of weather, illumination, and scale conditions. These benchmarks have spurred the development of robust detection models specifically engineered to address challenges inherent to aerial perspectives, such as extreme aspect ratios, dense object clustering, and diminutive object sizes. A significant application is found in UAV-based wildlife monitoring, where systems are deployed for animal census in conservation areas [2558], highlighting the utility of aerial technologies in promoting ecological sustainability. Figure 9.17 relates the aerial-specific difficulties of orientation, scale, and density to the detectors built for them and to the human-centric understanding that aerial video enables.
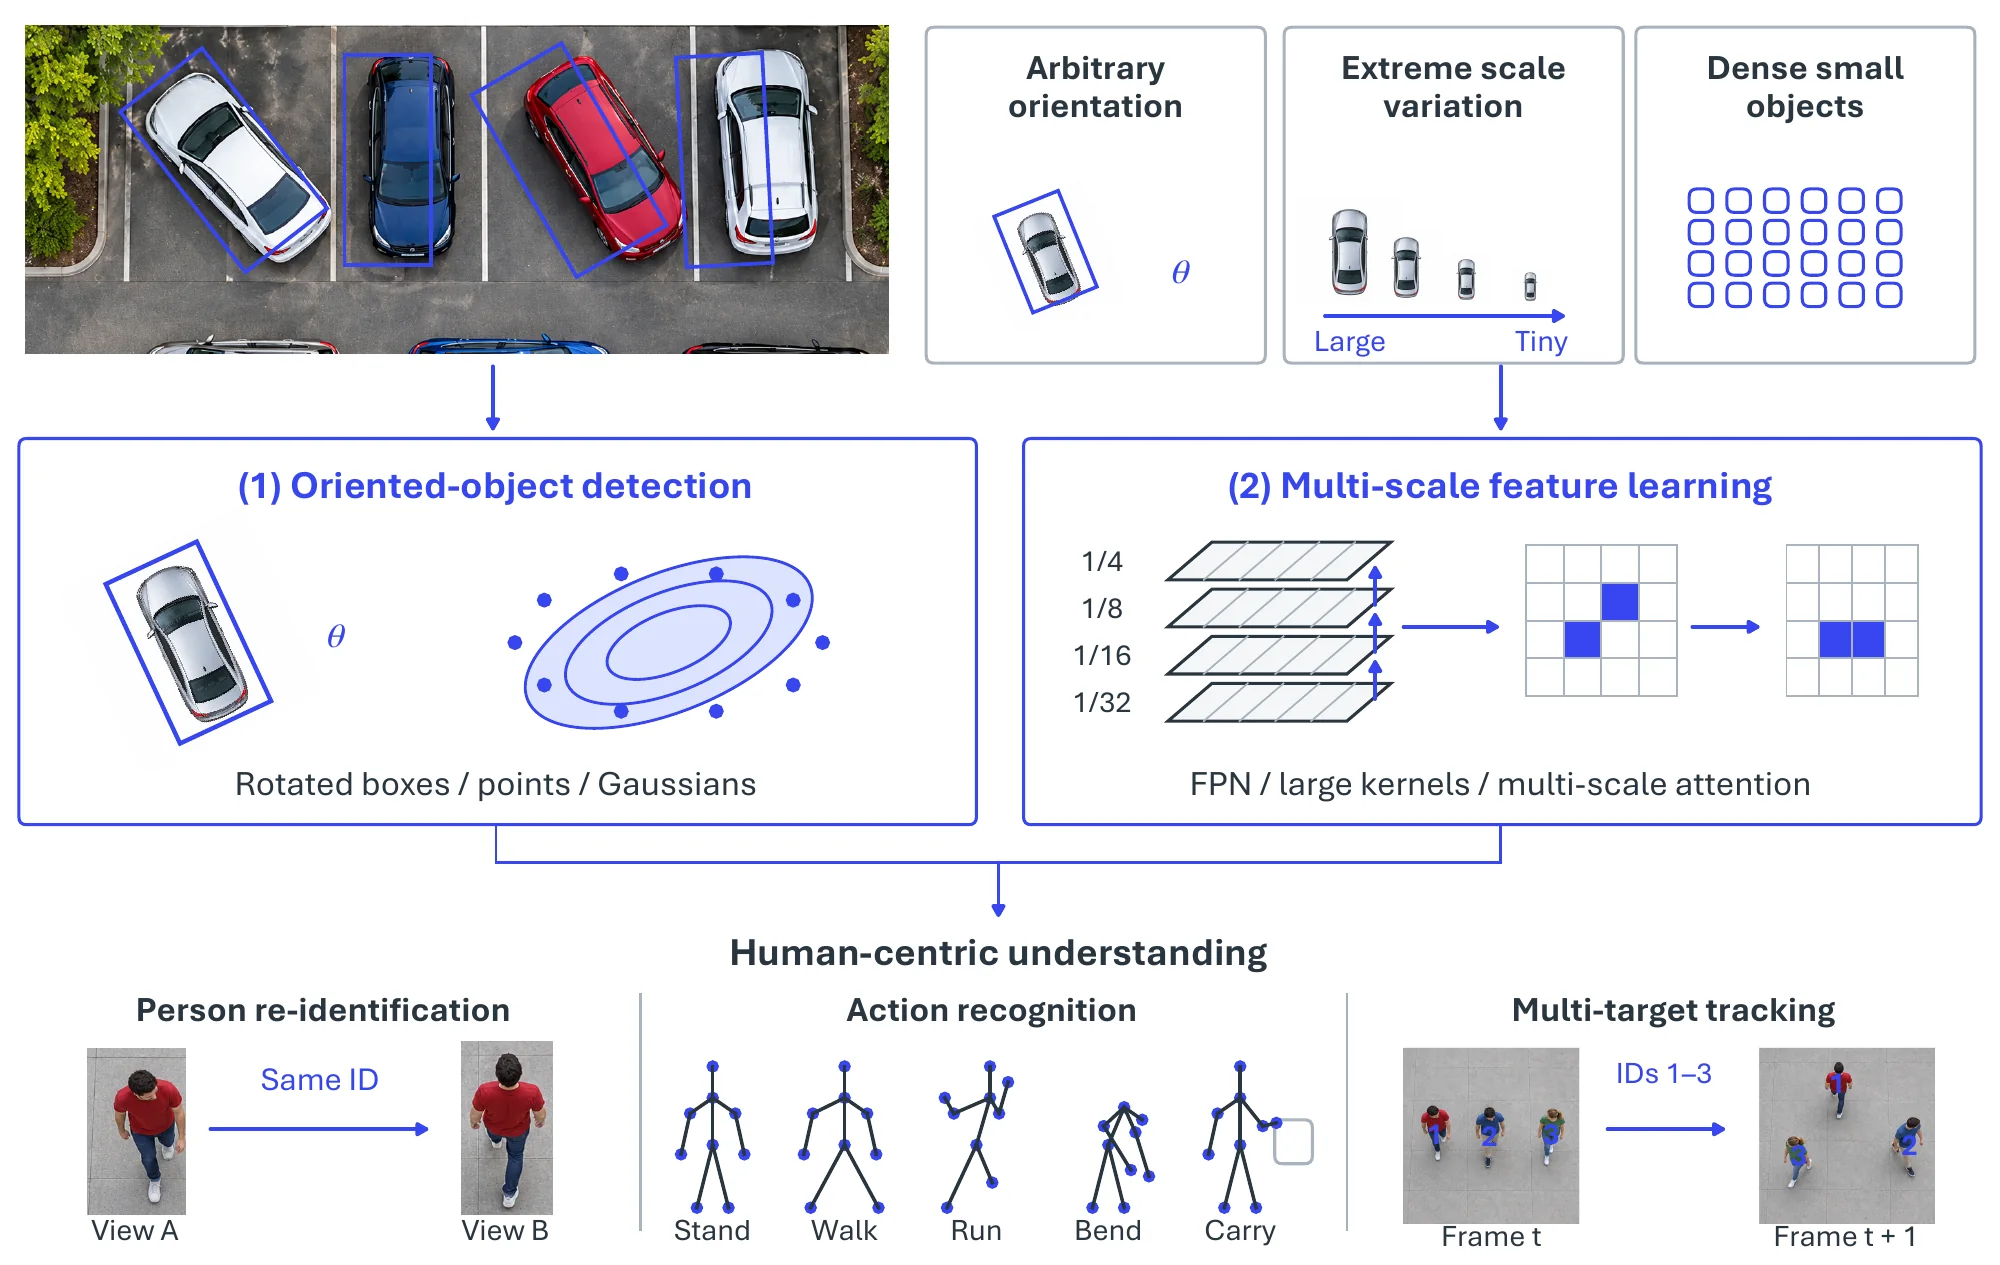
Beyond object detection, as shown in Table 9.7, with the proliferation of UAVs in smart-city and other human-centric applications, human behavior understanding [2531] has emerged as a critical and formidable research challenge, including person re-identification and action recognition. For instance, the UAV person re-identification (re-ID) task [2559] is designed to address cross-drone identity matching amid substantial viewpoint and illumination variations, thereby motivating the creation of view-invariant feature representations. In conjunction with resources like VisDrone, which contains multi-target tracking sequences from mobile UAVs, these datasets facilitate the design of intelligent video analytics systems capable of performing long-term human behavior analysis and anomaly detection in dynamic environments.
| Feature | UAV-Human [2531] | DOTA-v2 [2555, 2556] | VisDrone [2557] |
| Primary Focus | Human Behavior Understanding | Object Detection | Object Detection / Tracking / Crowd Counting |
| Data Type | Videos & Images | Images | Videos & Images |
| #Images | 22,476 frames for pose estimation, 41,290 frames for re-ID, 22,263 frames for attribute recognition | 11,268 | 10,209 |
| #Videos | 67,428 | N/A | 288 |
| #Categories | 155 action categories | 18 object categories | 10 object categories |
| #Instances | 119 subjects for action recognition, 1,144 identities for re-ID | 1,793,658 | ¿ 2.6 million annotated bounding boxes |
| Sensor Modalities | RGB, Depth, Infrared (IR), Fisheye, Night-Vision | RGB (from Google Earth, aerial) & Grayscale (from satellites) | RGB |
| Image Resolution | 19201080 (RGB), 640576 (Depth,IR), 640480(Fisheye, Night-Vision), | 800800 to 20,00020,000 pixels | 20001500 (image), 38402160 (video) |
| Annotation Format | Bounding boxes, 17 keypoints for pose | Oriented Bounding Boxes (Quadrilaterals) | Bounding boxes with attributes (e.g., , occlusion) |
| Scene Diversity | Urban and rural, daytime and nighttime | Wide area, diverse landscapes (ports, airports, cities, etc.) | 14 different cities, urban and rural, various weather and lighting |
| Platform | Drone (DJI Matrice 100) | Satellite, Aerial Platforms | Drone |
Remote sensing object detection is primarily challenged by the prevalence of arbitrarily oriented objects and substantial scale variations [2555, 2556, 2560, 2561, 2562, 2563], and existing research can be broadly organized along two corresponding fronts. Detection of arbitrarily oriented objects. A significant line of work focuses on developing specialized oriented object detection (OOD) methods. Early approaches often augment horizontal bounding boxes (HBBs) with an angle parameter, employing techniques such as feature refinement in the detector neck [2564, 2565], extraction of rotated regions of interest (RoIs) [2566, 2567], or designing specific OOD heads [2568, 2569, 2570]. However, these methods frequently suffer from boundary discontinuity and representation ambiguity due to their reliance on angle parameters. To mitigate these issues, subsequent research has explored more flexible object representations: some methods describe oriented objects using points [2571, 2572] or gliding vertexes [2573], while others model them with Gaussian distributions [2574, 2575, 2576] and design corresponding loss functions [2577]. Handling substantial scale variations. Another research direction designs specialized backbones and feature extraction strategies to cope with large scale variations in remote sensing images (RSIs). A common strategy is multi-scale feature learning, achieved through data augmentation [2578, 2579, 2580], multi-scale feature integration [2581, 2582, 2583, 411], enhanced feature pyramid networks (FPNs) [597, 2584, 2585, 2586], or multi-scale anchor generation [2587, 2588, 2589]. Other works focus on ensuring equivalent receptive fields for objects of different orientations [2569, 2590]. More recently, some methods [2591] have employed large kernel convolutions [237, 2592, 2593] to enlarge the spatial receptive field for large objects, though this can introduce background noise for smaller ones, while others harness multi-scale convolution kernels and attention to address scale variance [2594, 2595, 2596, 2597].
These method fronts are evaluated on a complementary set of benchmarks and metrics. The VisDrone dataset [2557] provides a comprehensive benchmark for drone-captured imagery, featuring urban and rural scenes with challenges like varying altitudes and occlusions; DOTA-v2 [2555, 2556] focuses on oriented object detection in high-resolution satellite images, emphasizing rotated bounding boxes for objects like planes and ships; and UAV-Human [2531] targets human behavior understanding from UAVs, with multi-modal sequences for pose and action analysis. Complementary datasets, such as UAVDT [2598] for traffic surveillance and iSAID [2599] for instance segmentation, broaden the scope of aerial detection tasks and collectively enable cross-dataset fine-tuning to mitigate domain gaps. Evaluation extends standard metrics to address orientation, scale, and density: the primary metric, mean Average Precision (mAP), is computed as the area under the precision-recall curve, typically at an Intersection over Union (IoU) threshold of 0.5 (mAP@0.5) or across 0.5:0.95 for stricter assessment [440], and for oriented detection, as in DOTA-v2, rotated IoU variants ensure alignment with object headings [2555]. Per-class and per-size Average Precision exposes imbalances, and small objects ( pixels) remain the main source of error on drone imagery [2557]. Additional metrics include precision, recall, and F1-score to assess false positives (e.g., , background clutter) and misses (e.g., , occlusions), while Frames Per Second (FPS) is critical for real-time UAV deployment, targeting 30+ FPS [2600]. Video-specific metrics like Multiple Object Tracking Accuracy (MOTA) are used for dynamic scenes in datasets like UAV-Human [2531]. Modern real-time detectors of the YOLO family [2601] are increasingly adapted to the aerial setting, though aggregated aerial mAP still trails their COCO-level performance owing to small-object and orientation hardness, keeping open gaps such as multi-modal fusion and zero-shot adaptation active.
9.4.5Pivotal Task-3: Autonomous Aerial Navigation and Decision Making#
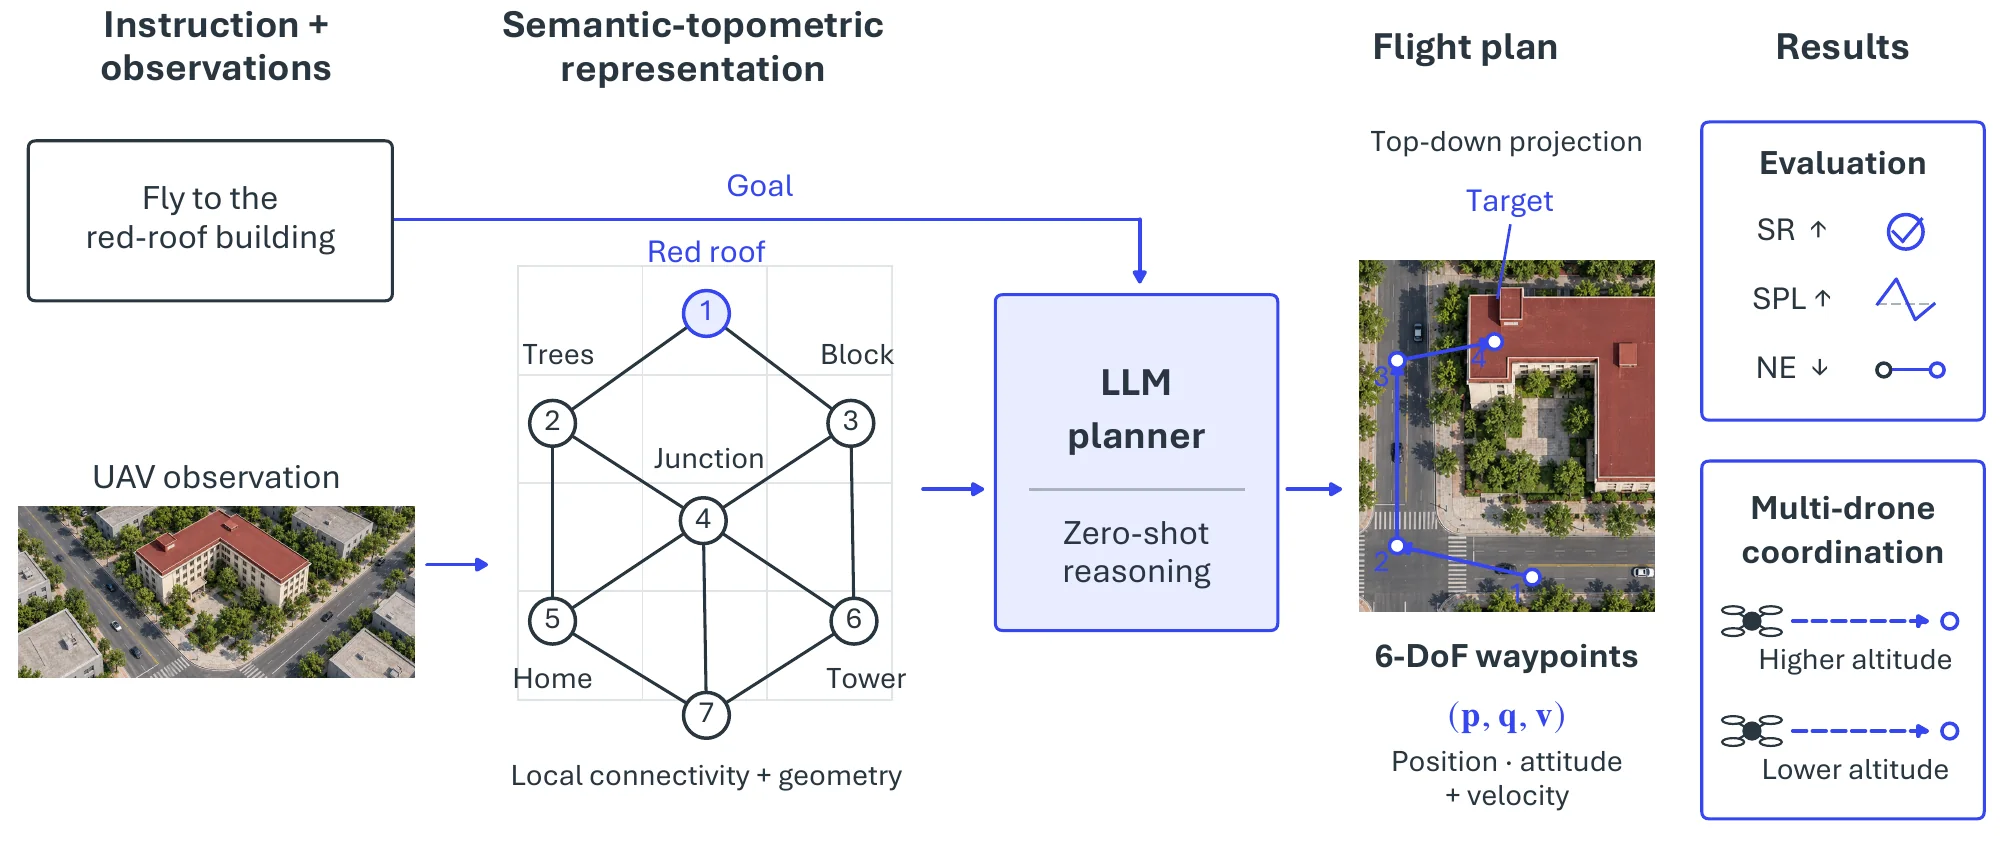
The final stage closes the loop, converting perception into action. Traditional UAV geolocalization addresses basic aerial navigation by matching a query (e.g., , a satellite image or textual description) to a database of historical flight paths or geographic points [2506, 2540]. However, a critical distinction exists between such perception-oriented tasks and the overarching goal of autonomous navigation: the latter requires complex decision-making and control to bridge perception to action, drawing on the spatial-reasoning and planning paradigms of Chapter 7. In practical scenarios, the objective is often for an aerial agent to autonomously locate a destination, particularly an unexplored target, through environmental exploration and, when available, collaboration with a map. This goal introduces significant challenges in generalization to unseen environments, including novel objects, unmapped regions, and interaction with the environment. For instance, recent benchmarks adapted from general Vision-Language Navigation (VLN) have begun to address this by requiring models to output a detailed flight plan with 6-DoF control signals [2602]. Figure 9.18 follows the problem from the perception-to-action gap to foundation-model-driven VLN and multi-agent extensions.
| Dataset | Yr | Env. | Size | Modalities | Key Features |
| UAVA [2603] | 2020 | Indoor simulated (MP3D) | 90 traj. | RGB, depth, flow, ego/exo views | Photorealistic UAV assist; vision/robotics tasks; gamified traj. |
| AVDN [2604] | 2022 | Outdoor simulated (xView) | 3,064 traj. with dialog | RGB, dialog | Async human dialogs; attn. for interactive nav. |
| AerialVLN [2605] | 2023 | Outdoor simulated (cities) | 8,446 traj. and 25,338 instructions | RGB, lang. instr. | Synthetic VLN; landmark nav in urban scenes. |
| CityNav [2606] | 2024 | Real-world (UK cities) | 32,637 traj./instr. | 3D point clouds, RGB, geo-lang | Real 3D scans (4.65 km²); human demos; scalable VLN. |
| UAV-Need-Help [2602] | 2024 | Outdoor simulated (OpenUAV) | 12,149 traj. | RGB, lang. instr. | Continuous 6-DoF traj.; target-oriented. |
| OpenFly [2607] | 2025 | Outdoor real/sim (18 scenes) | 100k traj. | 3D point clouds, RGB, lang. instr. | Large-scale; real-to-sim transfer. |
| AirV2X [2608] | 2025 | Outdoor simulated (CARLA+AirSim) | 6.73 hours of UAV-ground traj. | 3D point clouds, RGB | V2X collab; drone strategies; reduces occlusions. |
From visual perception to language-guided planning. Recent years have witnessed significant progress in UAV navigation, with a primary focus on visual perception [2609, 2610, 2611, 2612, 2613, 2614, 2615] and collision avoidance [2616, 2617]. Building on this aerial-perception foundation, Vision-and-Language Navigation (VLN) for UAVs remains an emerging area of research. To address it, recent efforts have leveraged Large Multi-modal Models (LMMs) to harness general knowledge for navigation planning: STMR [2618] builds upon AerialVLN [2605] with a zero-shot LLM-based framework utilizing a Semantic-TopoMetric Representation for enhanced spatial reasoning. A parallel line reframes UAV autonomy as a full agentic loop rather than one-shot instruction following. AeroVerse [2619] assembles a simulator, real-virtual pre-training corpora, and five downstream tasks, i.e., , scene awareness, spatial reasoning, navigational exploration, task planning, and motion decision, to train aerospace embodied world models, and proposes SkyAgentX as a unified perception-reasoning-navigation-planning agent; AirVista-II [2620] pursues zero-shot dynamic-scene semantic understanding via agent-based task scheduling and adaptive keyframe selection; and PRPSearcher [2621] casts aerial visual object search over the CityAVOS benchmark as a perception-reasoning-planning problem solved by a multimodal LLM agent. Complementary systems such as NeLV [2622] operationalize the language-to-flight pipeline end to end, chaining an LLM parser, route and path planners, and a control platform across short-, medium-, and long-range missions. Beyond single-agent setups, some works have begun to explore multi-drone systems; for instance, Wu et al. [2623] deploy two drones flying at different altitudes to facilitate planning.
Datasets and simulators. As shown in Table 9.8, several foundational frameworks and datasets have been established. One of the early works, i.e., , UAVA [2603], leverages the panorama images in the Matterport3D dataset [340] to render the indoor environment, while harnessing the camera viewpoints as physically available flight anchors to generate trajectories. AerialVLN [2605] introduces a large-scale dataset with an effective baseline, and further infrastructure contributions include datasets such as CityNav [2606], AVDN [2604], and OpenFly [2607]. Notably, UAV-Need-Help [2602] provides a realistic UAV dynamics simulator, i.e., , OpenUAV, alongside its evaluation protocol; OpenUAV is further used in HaL-13k [2623] to simulate two drones at different altitudes. Additional observation agents, such as road infrastructures and vehicles with depth sensing, have also been incorporated to enrich environmental understanding [2608].
Metrics. Evaluation metrics for UAV aerial navigation, especially VLN, measure how well a model navigates a drone based on visual inputs and language instructions. Common metrics include Success Rate (SR), which checks if the UAV reaches the target location within a specified distance, and Success weighted by Path Length (SPL), which balances success with how efficiently the drone travels (shorter paths score higher). Path Length (PL) measures the total distance traveled, while Navigation Error (NE) calculates the distance between the final position and the goal. Together these metrics assess both accuracy (reaching the target) and efficiency (taking an optimal route), providing a clear way to compare model performance across datasets like UAVA, AerialVLN, and CityNav.
9.4.6Established Tools and Systems#
Beyond the methods and benchmarks above, the aerial domain rests on a real-world layer of simulators, platforms, and infrastructure that turns research prototypes into deployable systems; we group it into three tiers.
Simulation environments and benchmarks. Because flight data is costly and safety-critical to collect, high-fidelity simulation underpins much of the field. The OpenUAV simulator released with UAV-Need-Help [2602] supplies realistic UAV dynamics and a continuous 6-DoF evaluation protocol, and is reused to simulate multi-altitude drone teams in HaL-13k [2623]; OpenFly [2607] targets large-scale real-to-sim transfer across diverse scenes; and AerialVLN [2605] pairs a city-scale synthetic environment with a navigation baseline. Photorealistic indoor rendering for UAV tasks is provided through Matterport3D [340] in UAVA [2603], while V2X-style multi-agent simulation combines CARLA and Microsoft AirSim1 in AirV2X [2608].
Commercial platforms and vendors. On the hardware side, consumer and enterprise drones from DJI2 (whose Matrice series collects datasets such as UAV-Human) and autonomy-focused vendors such as Skydio3 dominate the UAV tier. In the stratospheric tier, solar-powered HAPS such as Airbus Zephyr [2525] and AeroVironment/HAPSMobile’s HAWK30 [2526] provide persistent regional coverage, complemented by small-satellite constellations built on CubeSat platforms [2522] and broader HAPS programs [2523].
Connectivity and positioning infrastructure. Aerial autonomy ultimately depends on shared positioning and communication backbones: the GNSS constellations introduced above (GPS [2472], GLONASS [2475], Galileo [2476], and BeiDou [2477]) supply global timing and localization, while space-based broadband relays such as Starlink [2624] and orbital observation systems [2524] increasingly serve as the connectivity layer for coordinated, real-time aerial operations.
9.4.7Challenges#
Aerial autonomy is limited less by any single model than by the gaps between platforms, scales, and operating conditions. Four threads follow the pipeline in order: fusing heterogeneous platforms into a coherent situational model, perceiving small objects and complex activities reliably, navigating unseen and GPS-denied environments, and meeting the ethical and operational constraints under which any of this can be deployed.
Heterogeneous-Platform Fusion. A primary obstacle lies in integrating aerial agents with heterogeneous platforms for robust environmental perception. Coordinating a UAV with ground-based sensors or satellite systems to construct a cohesive situational-awareness model remains complex, particularly in dynamic or cluttered settings where the platforms differ in resolution, latency, and viewpoint (Table 9.5). Reconciling these asynchronous, multi-resolution streams into a single consistent representation, without one modality’s noise corrupting the fused estimate, is the standing difficulty, and it motivates the V2X-style cooperative-perception efforts that incorporate road infrastructure and ground vehicles as additional observers.
Small-Object and Complex-Activity Understanding. Aerial perception is defined by extremes of scale and density. The recognition of small objects, such as identifying debris in disaster zones or distinguishing wildlife in ecological surveys, demands high-resolution imaging and detectors robust to dense clustering, which often strain onboard computational resources. Understanding complex activities, such as discerning human behavior during search-and-rescue missions, compounds the problem by requiring nuanced spatio-temporal and contextual analysis that current systems struggle to deliver consistently. Closing this gap calls for detectors and activity models that remain accurate at extreme scale variation while fitting a UAV’s tight compute and power budget.
Navigation in Unseen and GPS-denied Environments. Autonomous operation in unseen or GPS-denied environments, such as dense urban canyons or subterranean spaces, further complicates the action stage, as agents must rely on real-time mapping and obstacle avoidance without pre-existing data. The core requirement is generalization: a navigation policy must extend to novel objects, unmapped regions, and genuinely interactive scenarios, rather than replaying matched trajectories. This is precisely the gap that foundation-model-driven VLN and multi-altitude cooperative planning aim to narrow, but validating such behavior to a safety standard in the open world remains open.
Privacy, Airspace, and Operational Robustness. Beyond perception and navigation, several ethical and operational challenges persist. Data-privacy concerns arise when aerial agents capture high-fidelity multimedia data, potentially compromising individual rights without stringent safeguards, motivating privacy-preserving approaches such as federated learning. Airspace integration poses another hurdle, as regulatory frameworks struggle to accommodate the proliferation of aerial agents alongside traditional aviation, necessitating harmonized protocols to ensure safety. Energy efficiency remains a critical bottleneck, since prolonged missions demand lightweight yet powerful power sources and motivate renewable solutions such as solar-powered propulsion. Finally, operational robustness is challenged by environmental uncertainties, such as extreme weather or electromagnetic interference, that can disrupt system reliability. Advances in artificial intelligence and sensor fusion that address these constraints, rather than perception accuracy alone, are what will let aerial agents move from bounded demonstrations toward dependable, large-scale deployment.